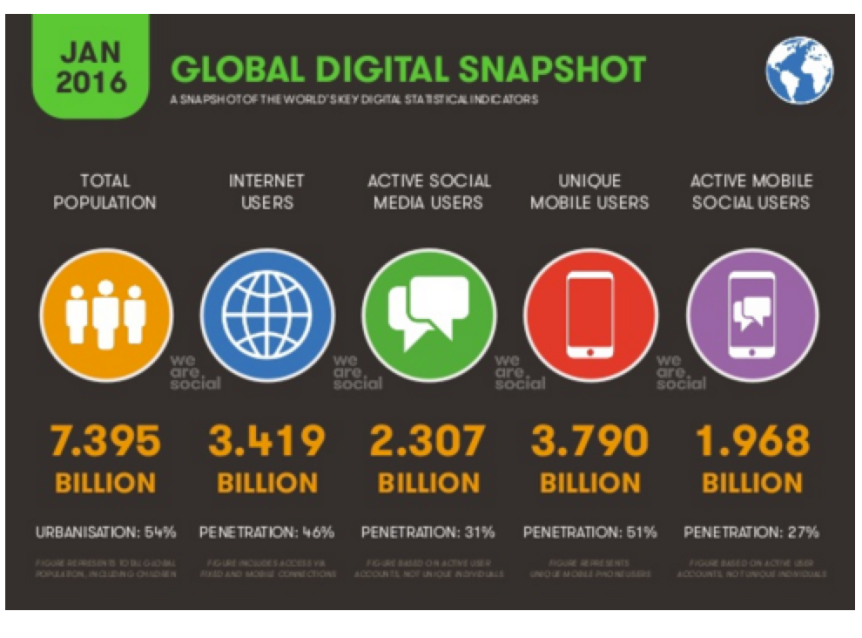
Social media is growing and there are statistics to back it up. Remember Myspace? and remember when Facebook was strictly for college students? Social media has changed drastically in the last 10 years and platforms are changing daily. With the introduction of platforms like Snapchat social media as marketers know it is not the same. To get to know where social media is today, here are the top social media statistics of 2016.
 According to Brandwatch.com:
- Social networks earned an estimated $8.3 billion from advertising in 2015
- 38% of organizations plan to spend more than 20% of their total advertising budgets on social media channels in 2015, up from 13% a year ago
- Only 20 Fortune 500 companies actually engage with their customers on Facebook, while 83% have a presence on Twitter
- People aged 55-64 are more than twice as likely to engage with branded content than those 28 or younger
- 96% of the people that discuss brands online do not follow those brands’ owned profiles
- 78 percent of people who complain to a brand via Twitter expect a response within an hour
- On WordPress alone, 56 million blog posts are published every month
- A 2011 study by AOL/Nielsen showed that 27 million pieces of content were shared every day
- The top 3 content marketing tactics are blogging (65%); social media (64%); and case studies (64%)
- Facebook now sees 8 billion average daily video views from 500 million users
- Snapchat users watch 6 billion videos every day
- US adults spend an average of 1 hour, 16 minutes each day watching video on digital devices
- 78% of people watch online videos every week, 55% watch every day
What statistics did find surprising?, comment below and share your thoughts.
Smith, K. (2016, Mar 7). Marketing: 96 Amazing Social Media Statistics and Facts for 2016. Brandwatch. Retrieved from https://www.brandwatch.com/2016/03/96-amazing-social-media-statistics-and-facts-for-2016/
